News & Event
2020 China International School Competitiveness Ranking
As an advanced and high-end platform of international educational recourses and services, and a promoter of international school ranking evaluation, brand media and scientific research education, KingLead has been conducting continuous and in-depth research and analysis on the competitiveness of international schools in China, deeply exploring the characteristics of international schools, in order to optimize evaluation standards, promote industrial upgrading and promote the cultivation of international innovative talents.
At KingLead International School Competitiveness Ranking Conference & Nobel Innovation Forum,
Witnessed by three Nobel Laureates,
Nobel Laureate in Economics
Nobel Laureate in Physiology or Medicine
Nobel Laureate in Physics
KingLead grandly released the
2020 China International School Competitiveness Ranking
Chaired professors from Harvard University and Cambridge University and more than 100 international school headers from Beijing, Shanghai, Guangzhou and Shenzhen also attended the event. KingLead International School Competitiveness Ranking Conference & Nobel Innovation Forum has received extensive attention from experts, scholars, school principles and managers, students and parents in the field of international education.
Because there are differences in admission process between U.S. universities and U.K. universities, The China International School Competitiveness Ranking is divided into two directions, one is for enrollment to U.S. universities, another one is for enrollment to U.K. universities.
Research Object
The schools in China mainland (except Hong Kong, Macao and Taiwan) which apply international high school courses and whose students are aiming at studying abroad.
Data Sources
All the data comes from objective data sources and exclusive data from KingLead Research Institute. There are 1258 official websites and 570 official WeChat subscriptions of international schools. 5 official websites of the examinations committee and 7 official websites of the certification Authority.

The main data sources are as follows:
The official website of IBO
The official website of College Board
The official website of CIE
The official website of Edexcel
The official website of AQA
The official website of NCCT
The official website of NEASC
The official website of CIS
The official website of WASC
The official website of ACAMIS
The official website of EARCOS
The official website of FOBISIA
Official website & WeChat official account of international schools
Exclusive data of the KingLead Research Institute
Ranking
Enrollment to U.S. Universities

Enrollment to U.K. Universities

Indicator System
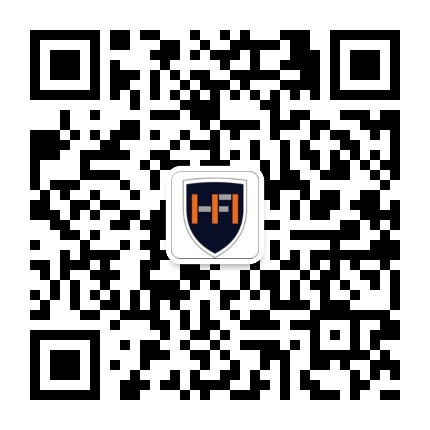
Based on available objective data and exclusive data from KingLead Research Institute, the ranking utilizes quantitative model and compositive weighted score to reflect international schools' comprehensive competitiveness from three core dimensions : International Certification, Faculty, and Enrollment to Universities.
Certification
This indicator includes two sub indicators: Certification by Mainstream Exam Committee, Certification by Mainstream Certification Authority.
Certification by Mainstream Exam Committee:
If IB course has been certificated by IBO
If AP course has been certificated by College Board
If IGCSE/A-Level course has been certificated by CIE
If IGCSE/A-Level course has been certificated by Edexcel
If IGCSE/A-Level course has been certificated by AQA
Certification by Mainstream Certification Authority:
NCCT
NEASC
CIS
WASC
ACAMIS
EARCOS
FOBISIA
Faculty
Faculty-Student Ratio
Percentage of Foreign Faculties
Percentage of Highly Educated Faculties
(with Master Degree or Above)
Enrollment to Universities
There are 6 sub-indicators according to the rankings of the U.S. universities that students have enrolled. The rankings of U.S. universities used in this ranking refer to U.S. News Best National University Rankings.
Number of students entering TOP 3 Universities
Number of students entering TOP 4-10 Universities
Number of students entering TOP 11-20 Universities
Number of students entering TOP 21-30 Universities
Number of students entering TOP 31-40 Universities
Number of students entering TOP 41-50 Universities
There are 6 sub-indicators according to the rankings of the U.K. universities that students have enrolled. The rankings of U.K. universities used in this ranking refers to U.K. universities selected as TOP 100 in U.S. News Best Global University Rankings.
Number of students entering TOP 2 U.K. Universities in TOP 100 universities
Number of students entering TOP 3 U.K. Universities in TOP 100 universities
Number of students entering TOP 4-5 U.K. Universities in TOP 100 universities
Number of students entering TOP 6-8 U.K. Universities in TOP 100 universities
Number of students entering TOP 9-10 U.K. Universities in TOP 100 universities
Number of students entering other U.K. Universities in TOP 100 universities

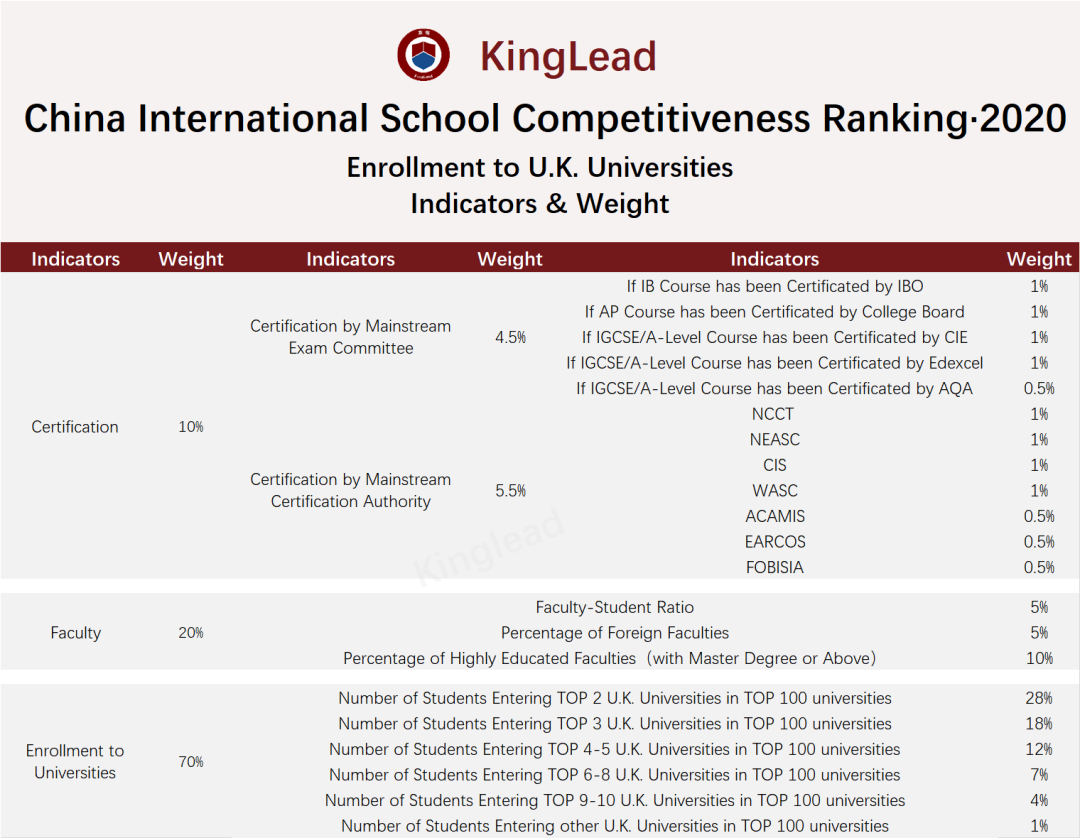
Rating System
Based on the score and ranking results, the competitiveness level of each school is rated as below:
The rankings 1-3 correspond to the "5A" rating, the 4-10 rankings correspond to the "4A" rating, the 11-30 rankings correspond to the "3A" rating, the 31-50 rankings correspond to the "2A" rating, ranking 51-100 corresponds to the "A" rating, ranking 101-200 corresponds to the "A" rating, ranking 201-300 corresponds to the " TOP300" rating,ranking 301-400 corresponds to the " TOP400" rating.
Data Processing
1. During the ranking process, for each of the 21 indicators, the school with the highest score is assigned with 100 points. Other schools are assigned values according to the ratio of the highest values for each indicator. Then, the school’s scores on 21 indicators are weighted, so that the school with the highest total score is 100 points, and the rest of schools score in proportion to the highest value.
2. Before the deadline, if a school’s objective data of college enrollment of Class of 2020 cannot be found, or its objective data doesn’t show which year it belongs to or which campus it belongs to, or its objective data is for the whole education group it belongs instead of this branch school to or all campuses including this branch school, this school is not included in the ranking.
3. Since every school has a different way of measuring objective data or describing data, each student’s enrollment result for the indicator of Enrollment to Universities is calculated as follows,
1) For the class of 2020, f a school’s objective data announces which university each student enters and who the student is, this student and his/her enrollment result is counted for this school.
2) For the class of 2020, if a school’s objective data only announces each student’s all offers received and who the student is, but doesn’t announce which university each student enters, the highest ranked university among offers received by each student is counted for this school.
3) For the class of 2020, If a school’s objective data only announces the total number of offers received by the whole class but doesn’t announce which university each student enters and who the student is, then assuming that each student of this school receives 5 offers on average, one-fifth of the total numbers of offers from each university is counted for this school. The final number small than 1 is counted as 1.
4) For the class of 2020, if a school’s objective data only announces a list of the universities where the whole class has received offers but doesn’t announce which university each student enters and who the student is, it is assumed that one student of this school enrolls one university in this list.
5) For the class of 2020, if a school’s objective data only announces the enrollment results of a part of Class of 2020, only the announced data are used.
6) In addition to the above situations, if a school's objective data doesn’t show which year it belongs to, or its objective data is for the whole education group it belongs to or is for all campuses including this branch school, then it is assumed that this school’s data for the indicator of Enrollment to Universities is missing.
Regional Distribution of the Top 3 International Schools
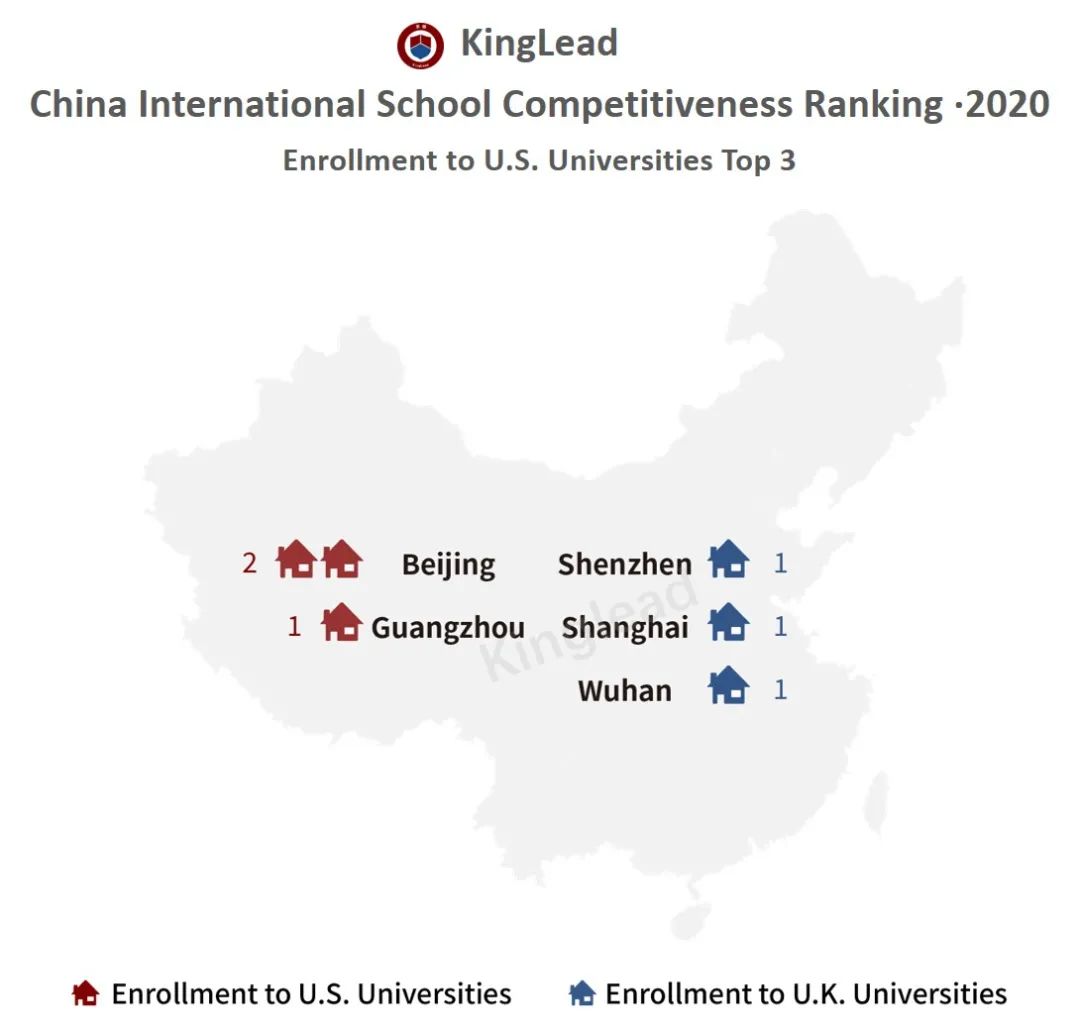
Among the top 3 international schools in the direction of Enrollment to to U.S. Universities, 2 schools are in Beijing and one is in Guangzhou. In the direction of Enrollment toU.K. Universities, the top 3 international schools are respectively in Shenzhen, Shanghai and Wuhan.
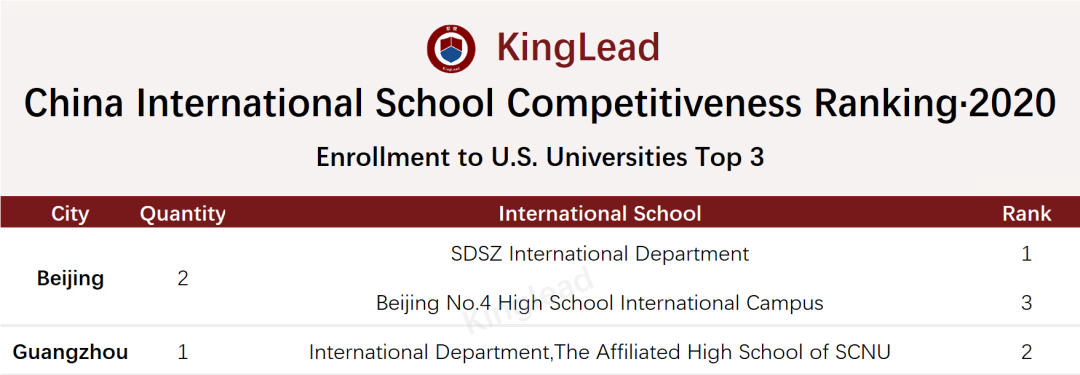
Among the top 3 international schools in the direction of Enrollment to U.S. Universities, the first place in the China International School Competitiveness Ranking·2020 is SDSZ International Department, the second place is International Department,The Affiliated High School of SCNU, the third place is Beijing No.4 High School International Campus.
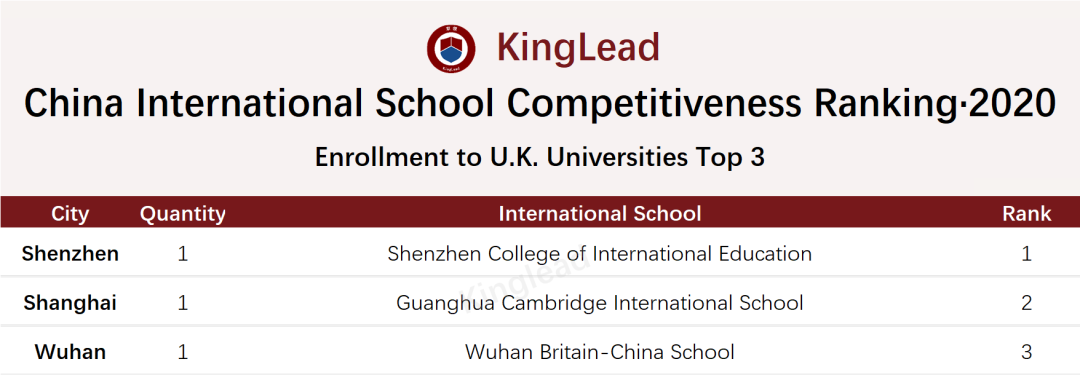
Among the top 3 international schools in the direction of Enrollment to to U.K. Universities, the first place in the China International School Competitiveness Ranking·2020 is the Shenzhen College of International Education, the second place is the Guanghua Cambridge International School, the third place is the Wuhan Britain-China School.
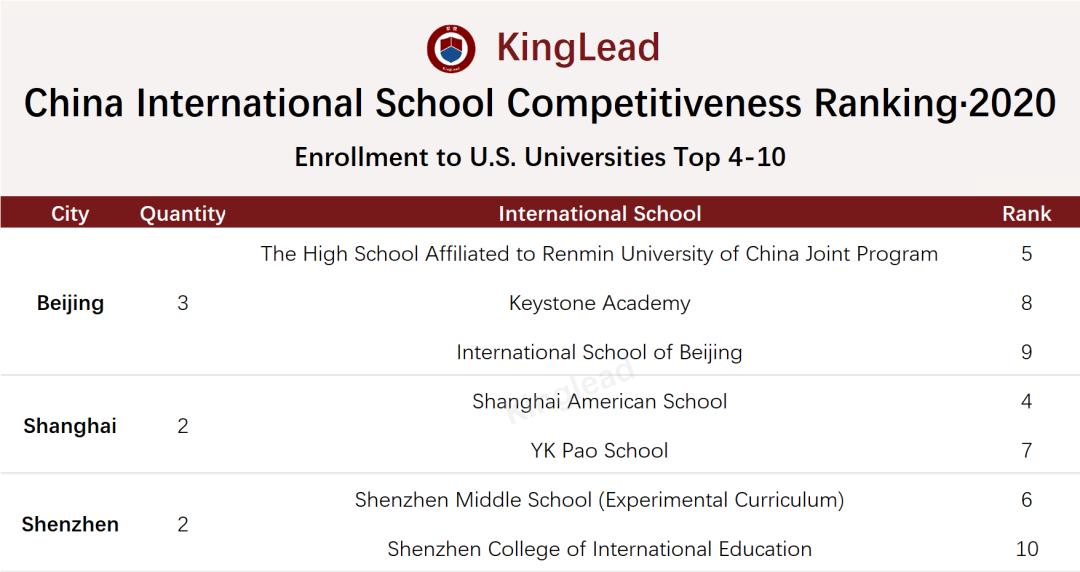
Regional Distribution of the Top 4-10 International Schools
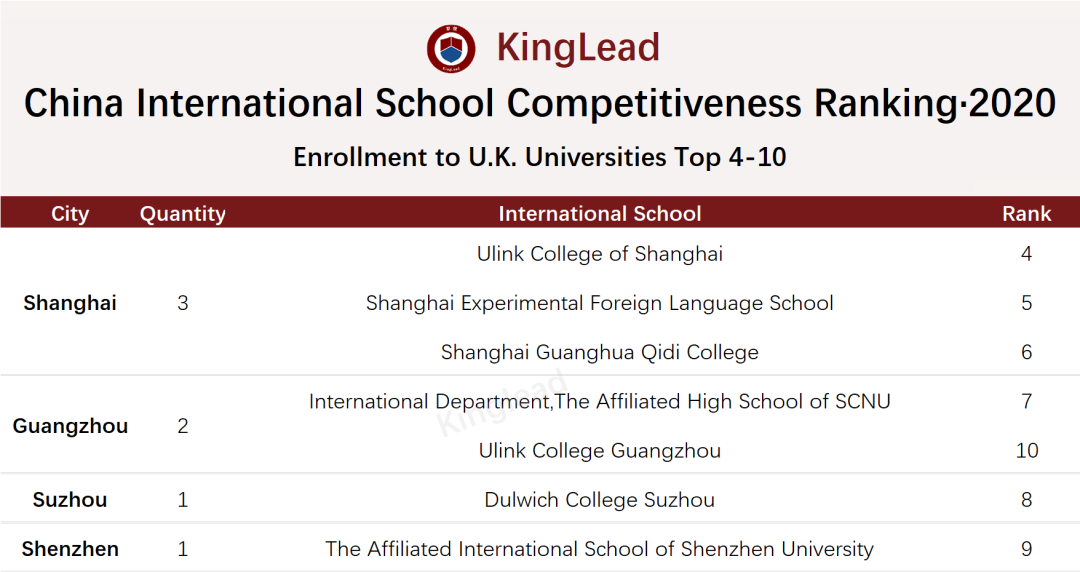
Among the top 4-10 international schools in the direction of Enrollment to U.S. Universities, Beijing has the largest number of selected international schools . Among the top 4-10 international schools in the direction of Enrollment to U.K. Universities, Shanghai has the largest number of selected international schools.
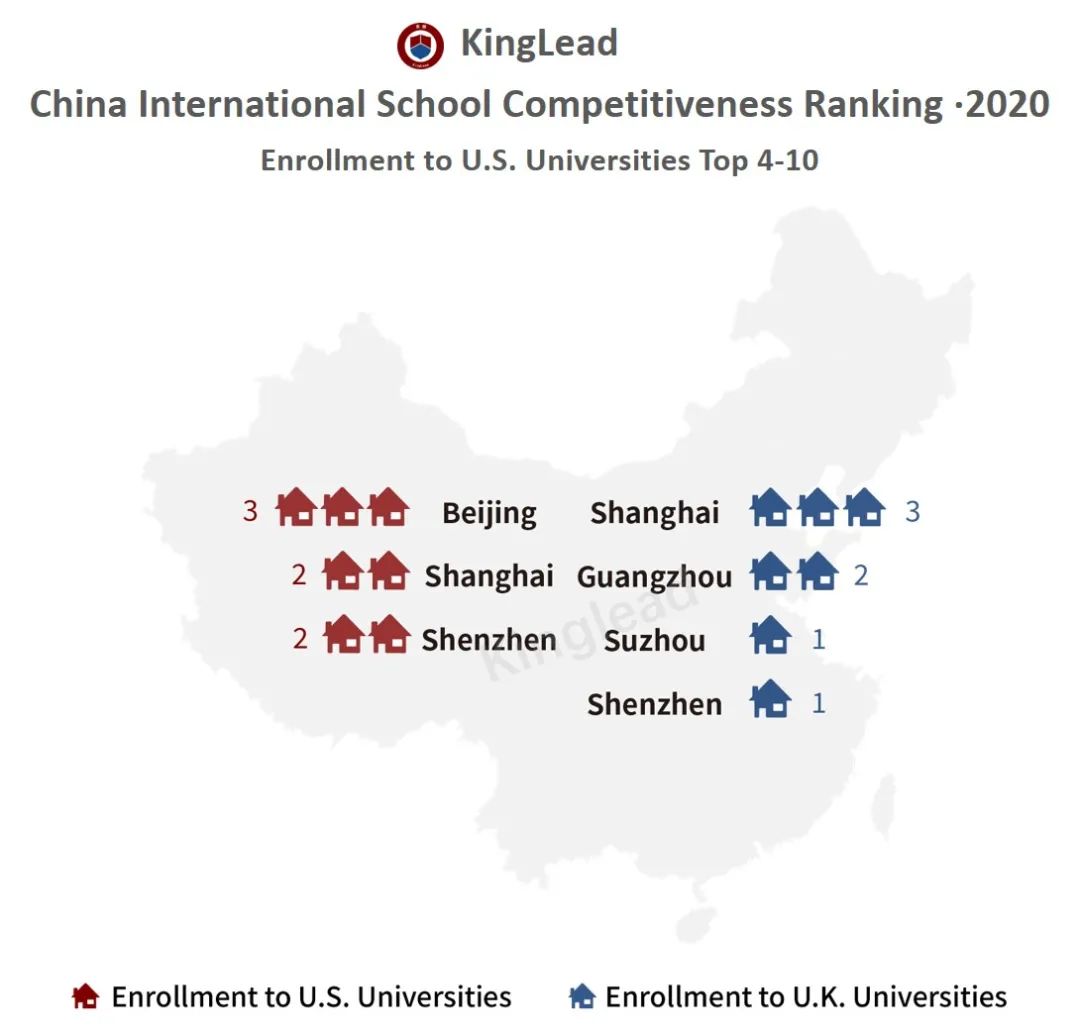
Among the top 4-10 international schools in the direction of Enrollment to U.S. Universities, Beijing has the largest number of selected international schools, with 3 schools selected. Followed by Shanghai and Shenzhen, each with 2 international schools selected.
Among the top 4-10 international schools in the direction of Enrollment to U.K. Universities, Shanghai has the largest number of selected international schools, with 3 schools selected. Followed by Guangzhou, with 2 international schools selected. In addition, Suzhou and Shenzhen each have one international school selected.
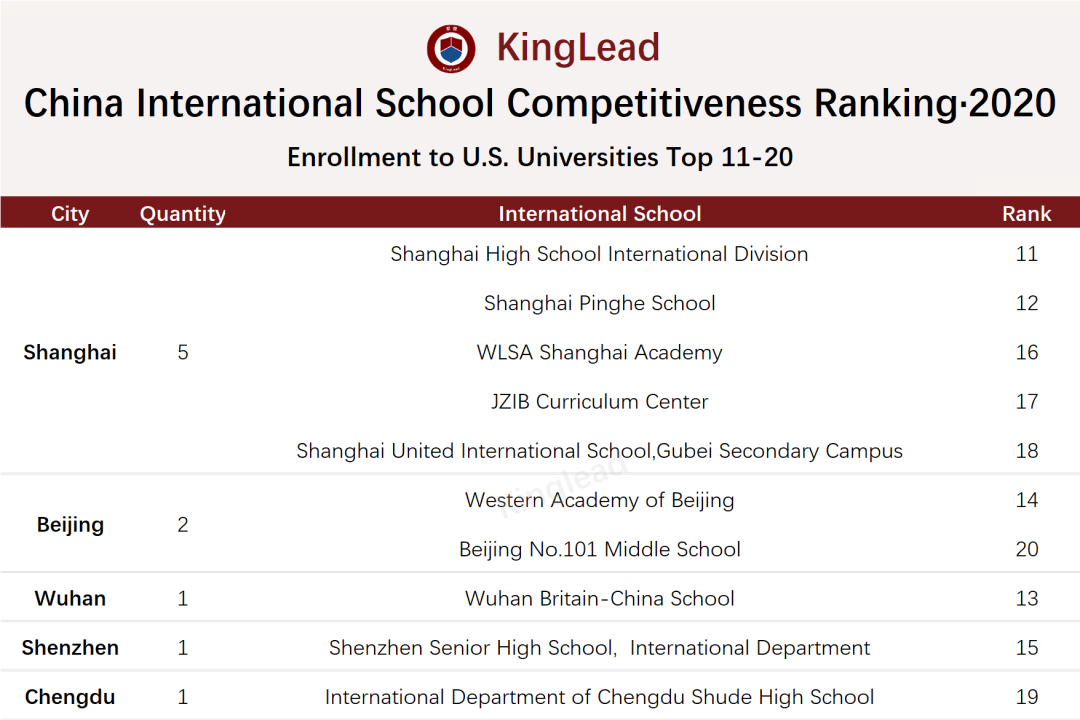
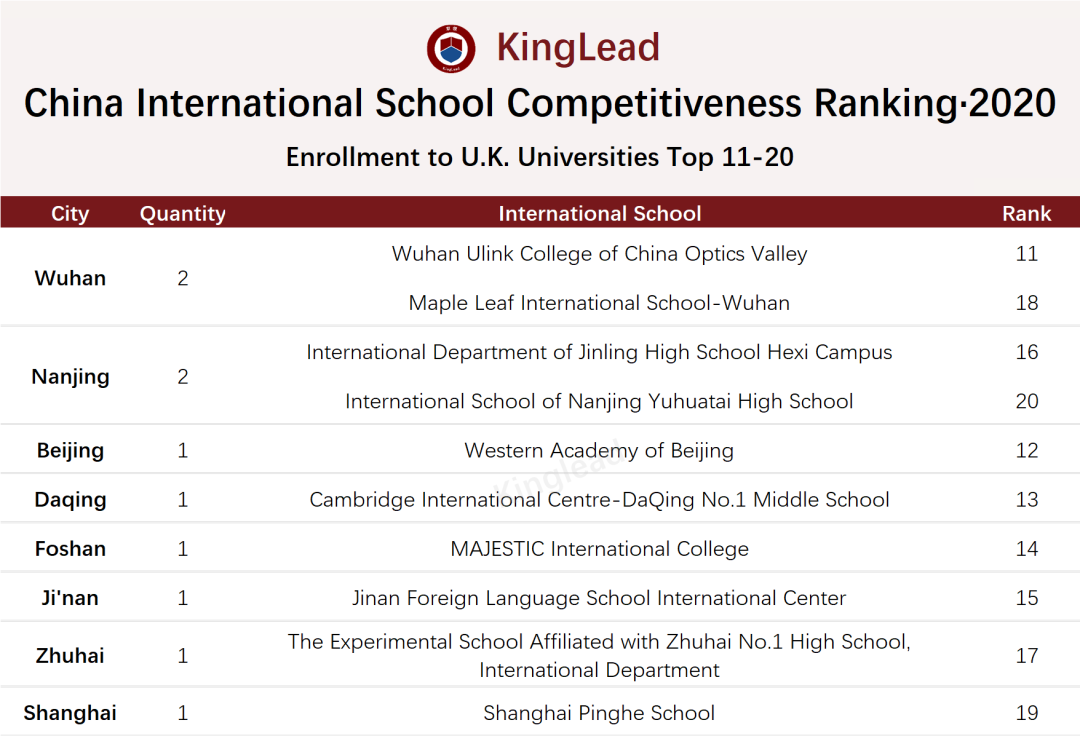
Regional Distribution of the Top 11-20 International Schools
Among the top 11-20 international schools in the direction of Enrollment to U.S. Universities, Beijing has the largest number of selected international schools. Among the top 11-20 international schools in the direction of Enrollment to to U.K. Universities, Wuhan and Nanjing tie for the first place in the number of selected international schools.
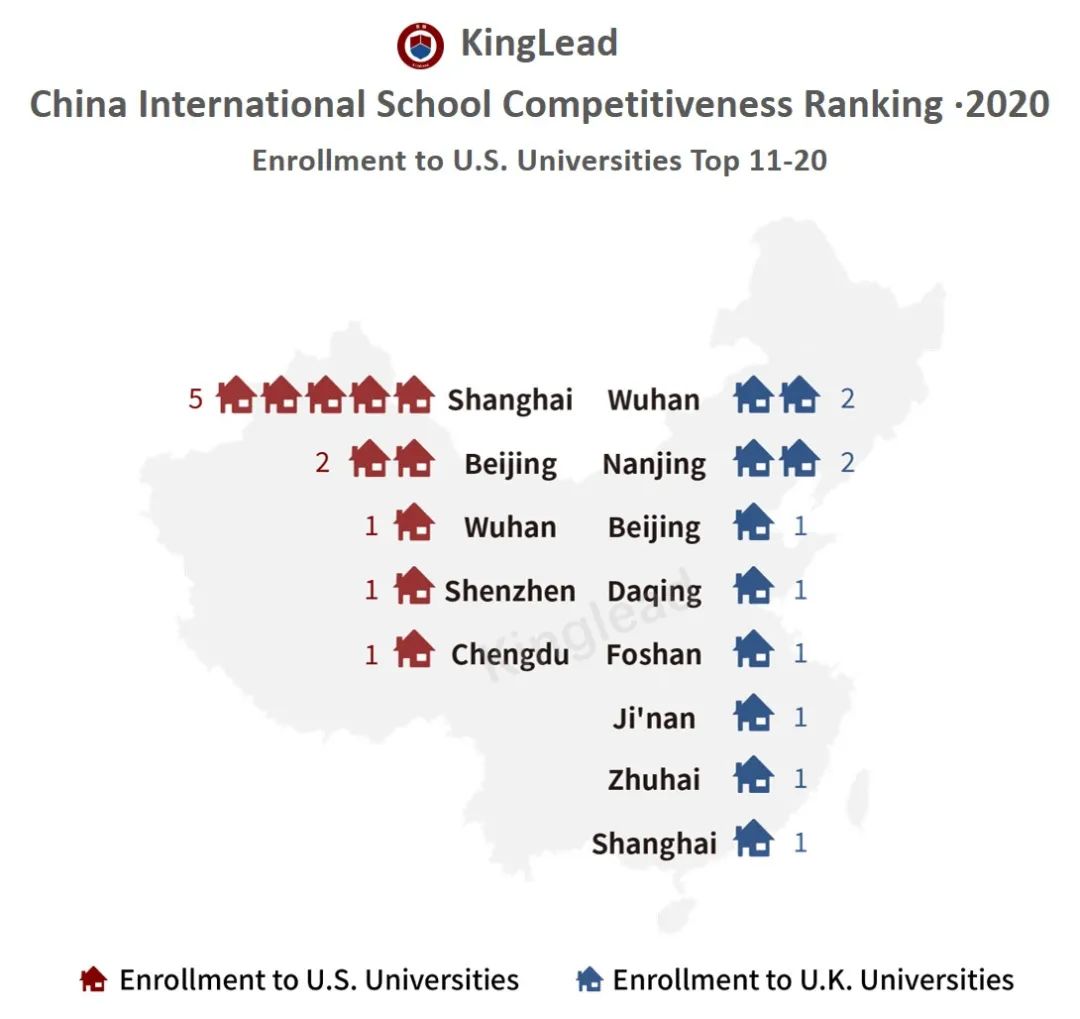
Among the top 11-20 international schools in the direction of Enrollment to U.S. Universities, Shanghai has the largest number of selected international schools, with 5 schools selected. Followed by Beijing, with 2 schools selected. In addition, Wuhan, Shenzhen and Chengdu each have one school selected.
Among the top 11-20 international schools in the direction of Enrollment to U.K. Universities, Wuhan and Nanjing tie for the first place in the number of selected international schools, each with 2 schools selected. Beijing, Daqing,Foshan, Jinan, Zhuhai and Shanghai each have one school selected.
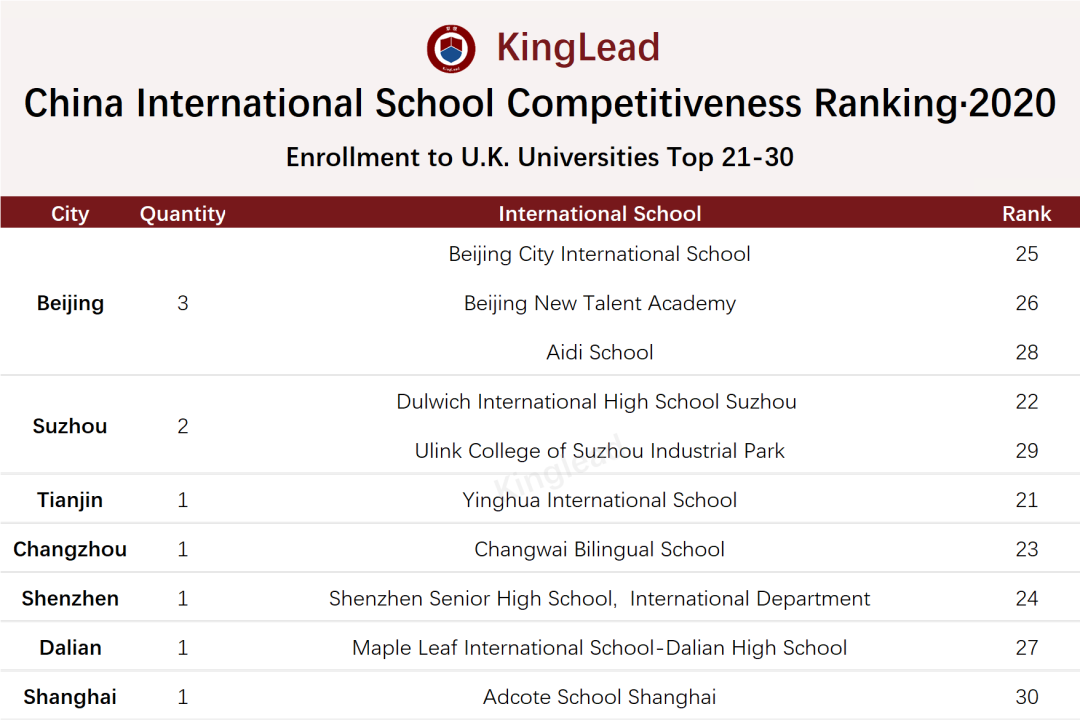
Regional Distribution of the Top 21-30 International Schools
Among the top 21-30 international schools in the direction of Enrollment to U.S. Universities ,Beijing has the largest number of selected international schools. Among the top 21-30 international schools in the direction of Enrollment to U.K. Universities, Beijing has the largest number of selected international schools.
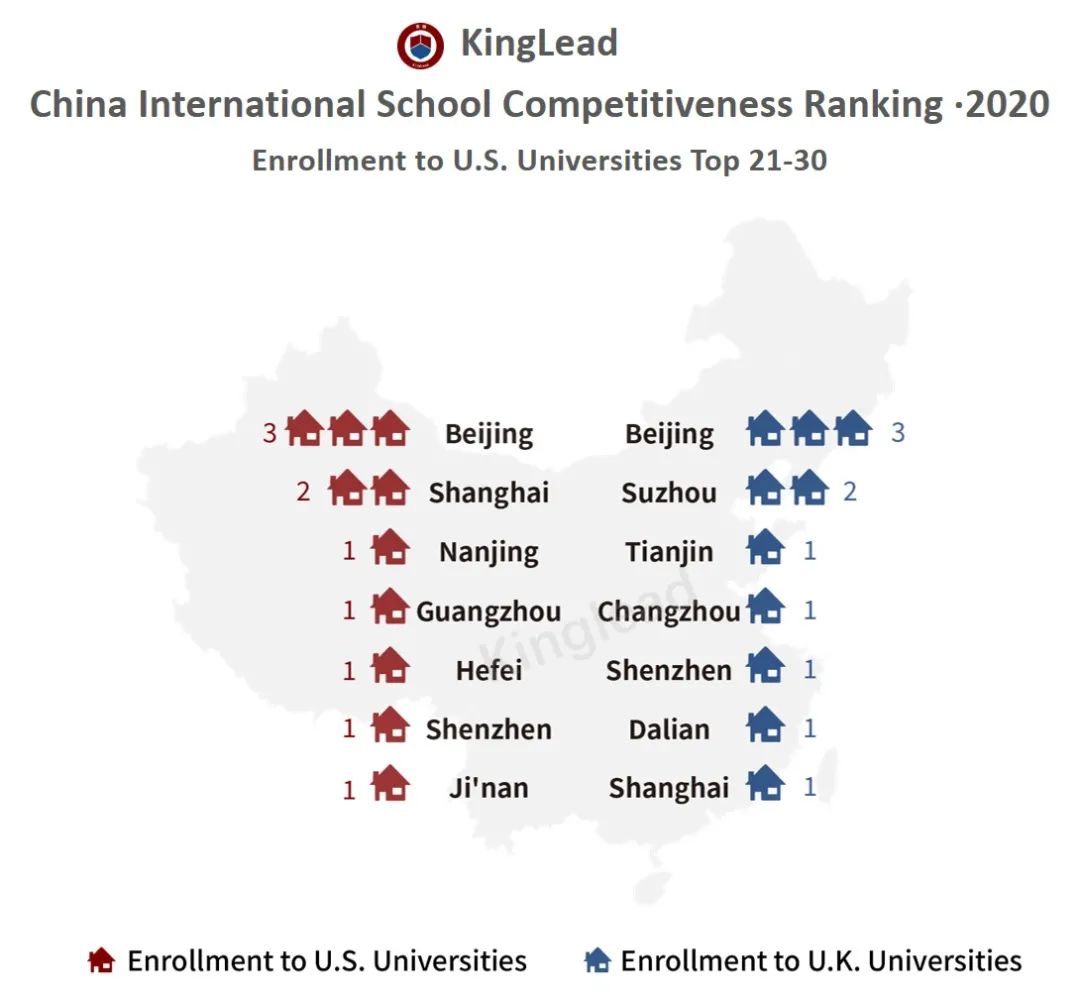
Among the top 21-30 international schools in the direction of Enrollment to U.S. Universities, Beijing has the largest number of selected international schools. , with 3 schools selected. Followed by Shanghai, with 2 international schools selected.Nanjing, Guangzhou, Hefei, Shenzhen and Jinan each have one school selected.

Among the top 21-30 international schools in the direction of Enrollment to U.K. Universities, Beijing has the largest number of selected international schools, with 3 schools selected. Followed by Suzhou, with 2 international schools selected. Tianjin, Changzhou, Shenzhen, Dalian and Shanghai each have one school selected.
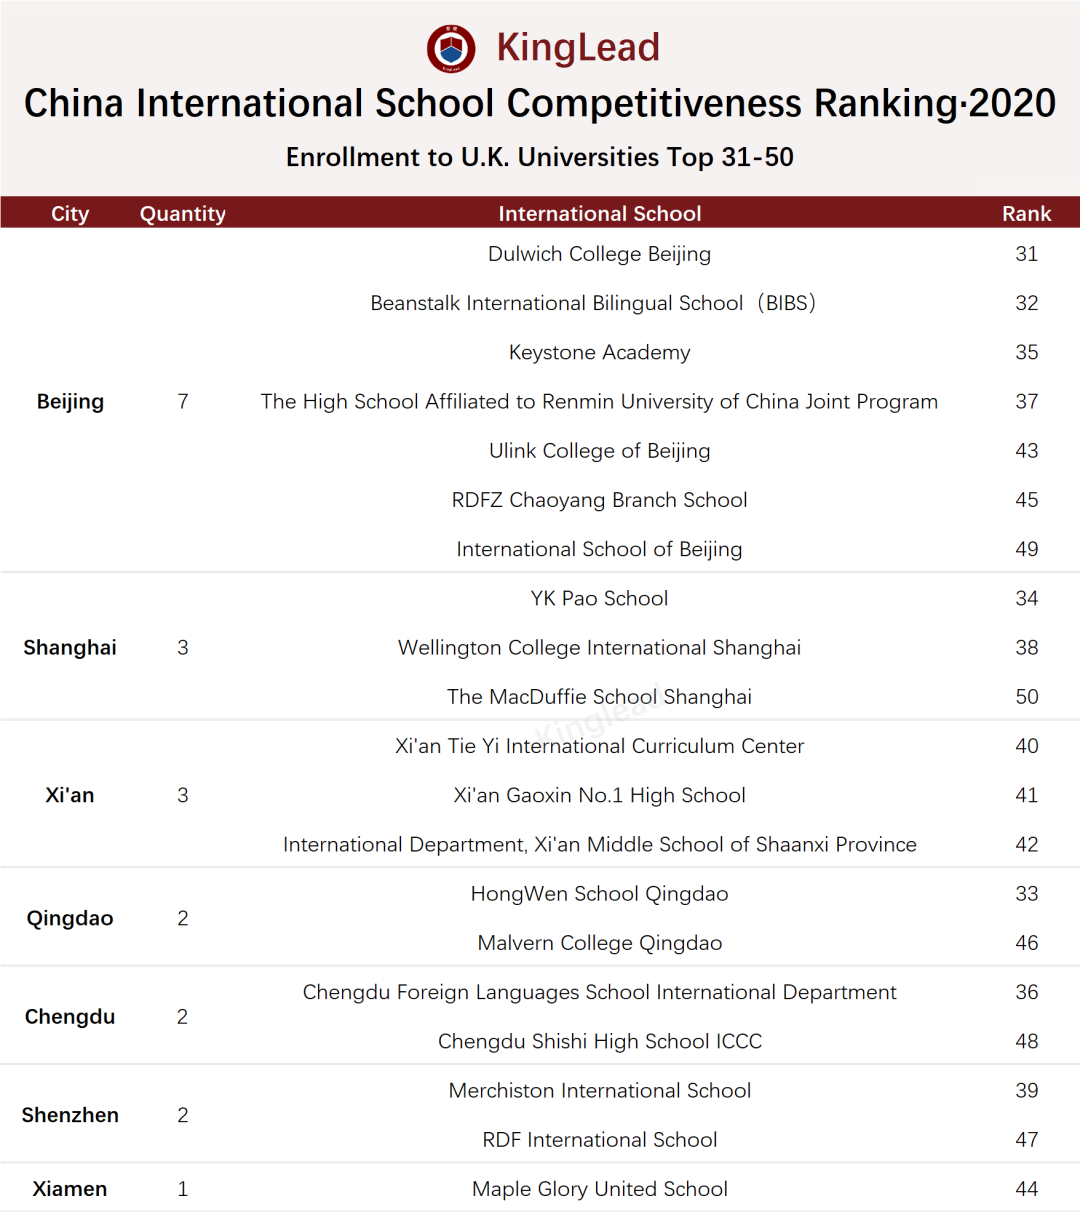
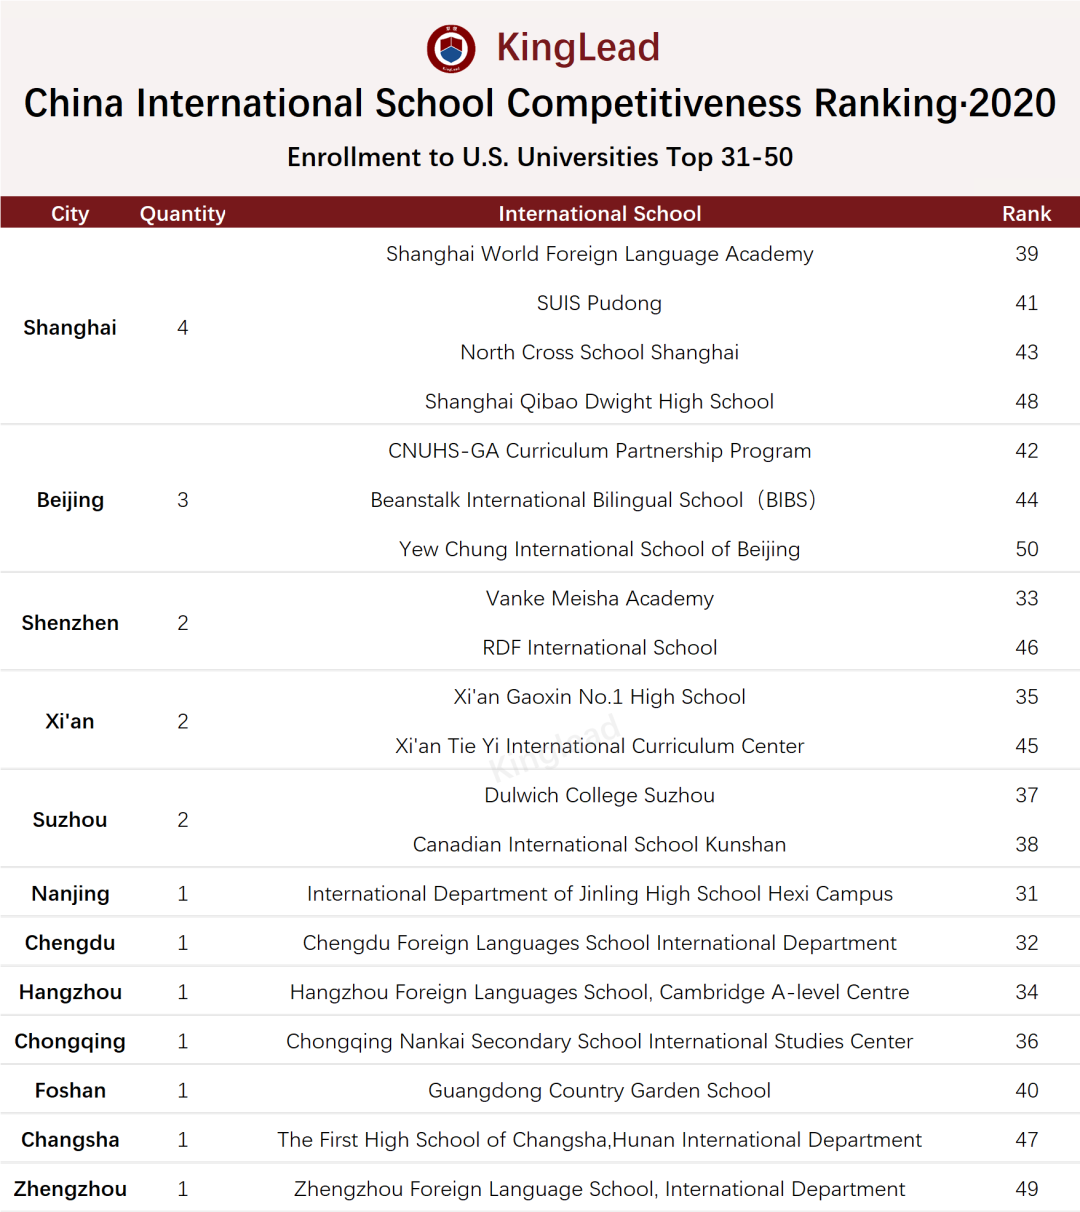
Regional Distribution of the Top 31-50 International Schools
Among the top 31-50 international schools in the direction of Enrollment to U.S. Universities, Shanghai has the largest number of selected international schools. Among the top 31-20 international schools in the direction of Undergraduate Admission to U.K. Universities, Beijing has the largest number of selected international schools.
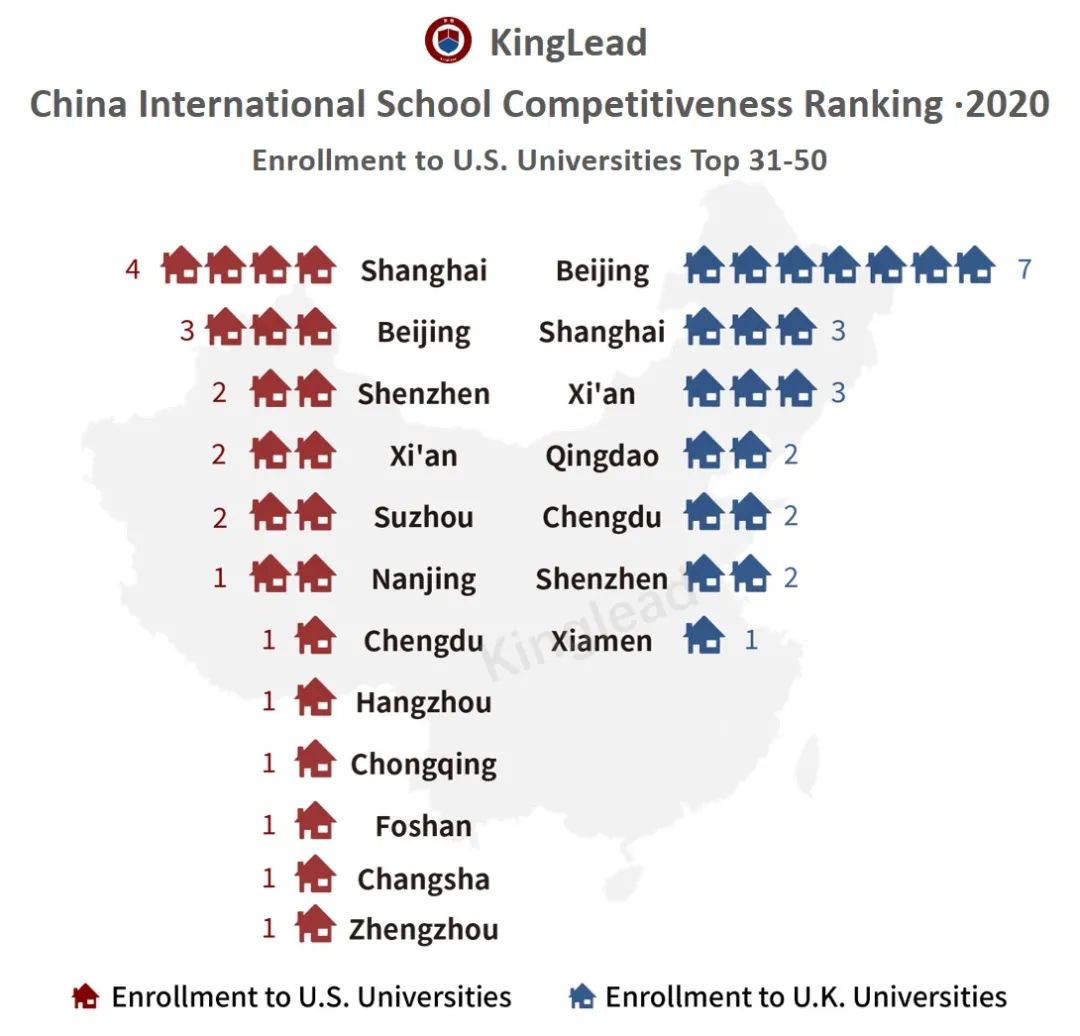
Among the top 31-50 international schools in the direction of Enrollment to U.S. Universities, Shanghai has the largest number of selected international schools, with 4 international schools selected. Followed by Beijing, with 3 international schools selected. Shenzhen, Xi'an and Suzhou, each with two international schools selected. Nanjing, Chengdu, Hangzhou, Chongqing, Foshan, Changsha and Zhengzhou each have one school selected.
Among the top 31-50 international schools in the direction of Enrollment to U.S. Universities, Beijing has the largest number of selected international schools, with 7 schools selected. Followed by Shanghai and Xi'an,each with three international schools selected. In addition, Qingdao, Chengdu and Shenzhen each have two international schools selected. Xiamen has one school selected.